Data Analyst Project: Business Decision Research
Prediction Customer Churn
Customer churn is a customer that did not do any transaction in a certain time. In this project, customer churn is a customer who does not make any transactions to the store during the last 6 months.
Data
This dataset is imaginary data and being a part of the DQLab Project. In the explanation, this data belongs to DQLab Sports Center, built-in 2013 with data collection from 2013 until early 2019.
Data Exploration
The first step to know the data is to do some exploration. Such as preview dataset, get dataset info, check missing value, and get summary statistics.
- Preview Dataset
From this preview, the dataset has numerical and categorical data types.

- Get Dataset Info
Dataset is consist of 10.000 entries (rows) and 8 columns, with int64 and object datatype. There is no non-null data in this dataset.

- Check Missing Value
To make sure this dataset does not have any missing value, check the missing value from each column. From this result, the dataset did not contain any missing or NaN value.

- Summary Statistics
This part gives some statistical information from the numerical column (default). Mean, maximum and minimal value, percentile, and other statistics.

Data Cleansing and Manipulation
The data exploration step gives some information, the next to do in data cleansing step.
- Drop unnecessary column(s)
Column no and Row_Num has no specific meaning, it’s like an index column. So it can be removed.
- Convert Data Type
From dataset preview column First_Transaction and Last_Transaction can be datetime datatype. Example, from 1.000000e+05 (int64) to 2018–10-05 05:48:02.608000040 (datetime64[ns]). Date in YYYY-MM-DD format.
- Add New Necessary Column
- Year Value from each column (First_Transaction and Last_Transaction)
2. Category from Average_Transaction_Amount. These columns divide into eight categories.
3. Add a column is_churn to labeling the customer churn or not
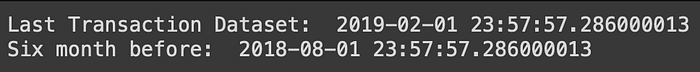
First, get the last transaction from the Last_Transaction column dataset and save it to date_last_transaction. Subtract 6 months with help from relativedelta library.
Then filter customer with two labels, False and True. If True, the customer didn’t do any transaction in the last 6 six months.
From the result, the last date transaction in 2019–02–01 and six months before in 2018–08–01.
Preview and Info Dataset After Data Cleansing ad Manipulation


Data Visualization
Visualized data to get an insight into the dataset. Some information we can get such as transactions per year, customers per year, the average amount of transactions per year, and trend products per year.
- Number of Customer per Year
To get the number of customers each year, column customer should be group by Year_First_Transaction.
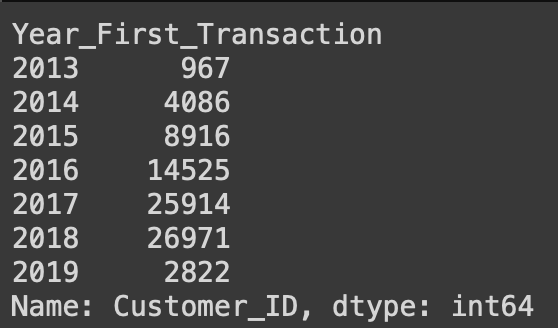
From the following graph, it can be seen that the number of customers has increased each year. The dataset contains data up to February 2019. So total customers in 2019 are still small.

- Number of Transaction per Year
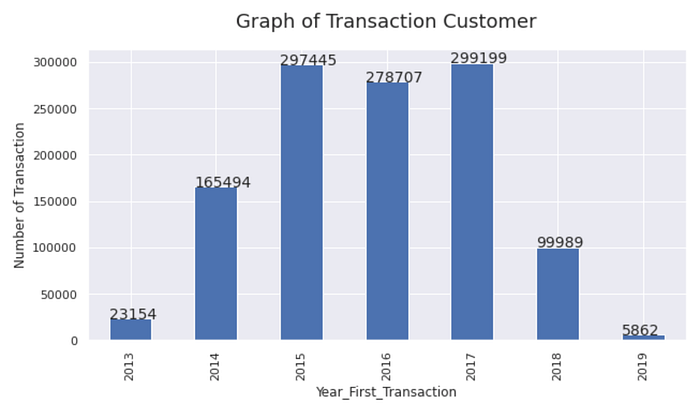
In 2018, the number of transactions decreased significantly by 199,210
transaction. This number greater than in 2016, which 18,738 transactions.
- Number of Average Amount Transaction per Year
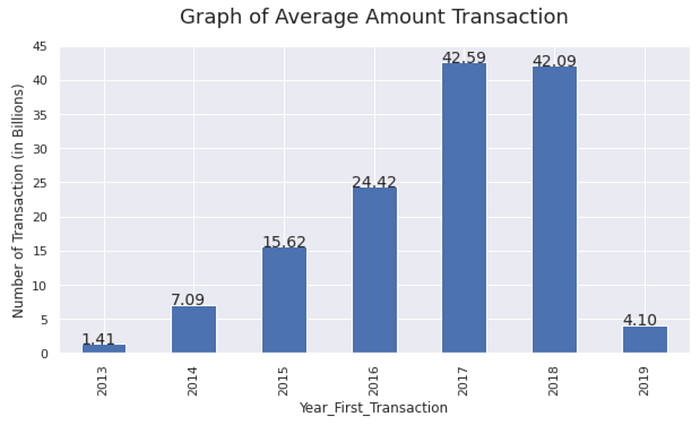
Based on data “Number of Transaction” transactions in 2018 decreased. But the number of transactions (in Billions) in 2018 still stable. The difference amount transaction from 2017 to 2018 decreased by 0.5 Billion.
- Trend Product per Year
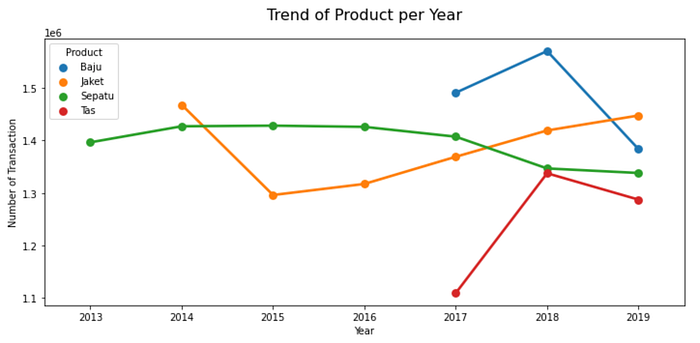
In the last five years, the jaket is a product on demand is increasing from year to year.
- Proportion Churn by Product
Pie graph show in subplots model. This graph needs a pivot table that subplot the graph based on columns in the pivot table.
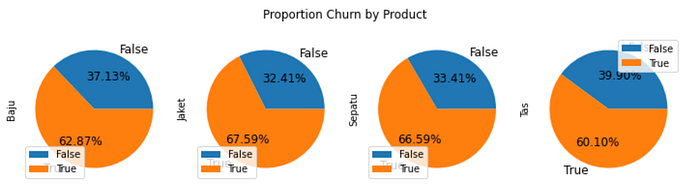
The graphs above show customer churn was more than 60% for each product. Assume customers need more variation of each product.
- Customer Distribution by Average Transaction Amount Group
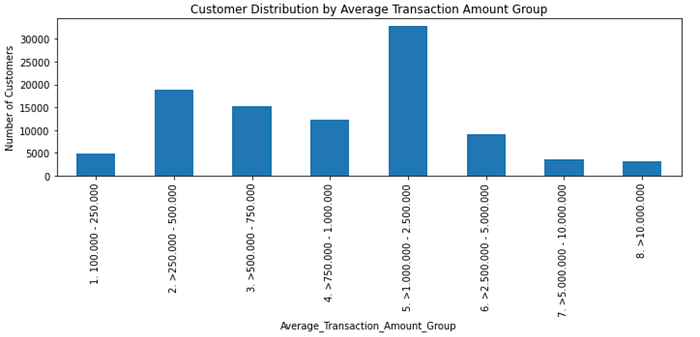
Many customers spend the amount in the range of 1.000.000 until 2.500.000 for each transaction.
Modeling
Data Correlation
Variable category with the object or category the data type can convert to a numerical way. For example in the Product column, the value of ‘0’ for ‘Baju’ and ‘2’ for a ‘Jaket’. This process is called encoding categorical values. Column to convert Product, is_churn, and Average_Transaction_Amount_Group.
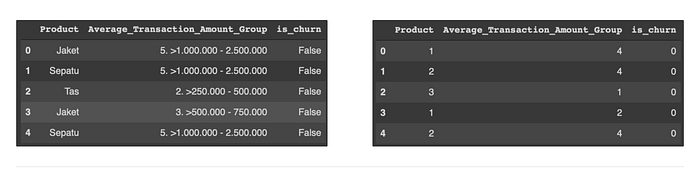
This process helps get the correlation between variables using a visualization graph and the machine learning model can train these variables.
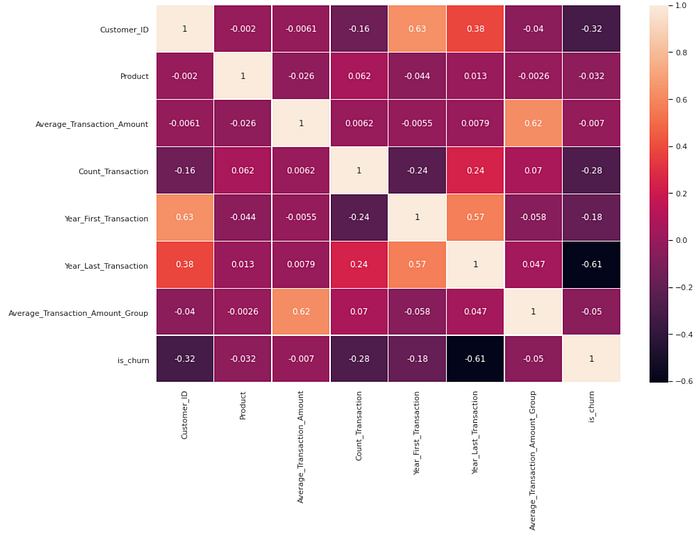
Visualize the data correlation between variables can use seaborn heatmap. The column is_churn will use as a label of the dataset. The correlation between label is_churn and other variables is negative. Variable such as transaction amount, product, and first-year transaction are a few top correlations.
Features and Label
X is features columns and y is label column. Column is_churn as the label.
Dataset features contain all columns except is_churn, First_Transaction, and Last_Transaction. Because of column First_Transaction and Last_Transaction in datetime64[ns] data type, not numerical data type (int or float). These columns already save year value in Year_First_Time and Year_Last_Time column.
Data train and test
This dataset split into 75% (75.000 entries) data train and 25% (25.000 entries) data test.
Machine Learning Method
- Logistic Regression
Logistic regression for classification problems with label or is_churn column in numeric type. Initially, the label consisted of True and False values (object datatype) and now changes to 1 and 0 (int64 data type).
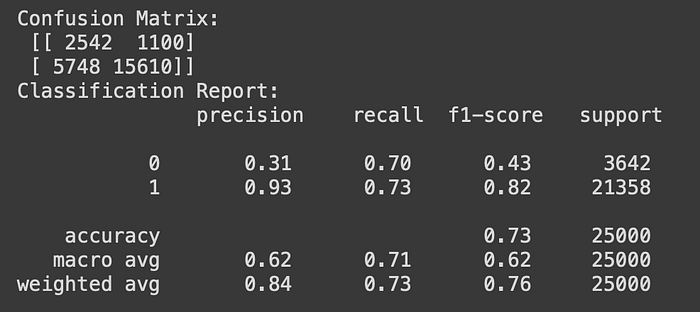
The precision value for label 0 is quite low at 0.31. This means the model tends to predict the label 0 incorrectly. The model accuracy at 0.73.
2. Decision Tree
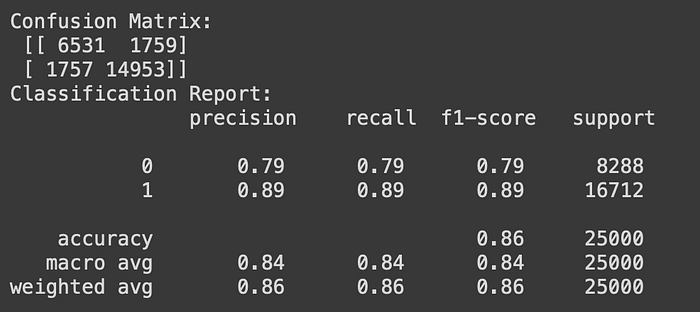
With the Decision Tree model, accuracy gets better. Model get accuracy at 0.86 and model precision both labels is near 0.80. This model performs much better than the Logistic Regression model.
3. K-Nearest Neighbor
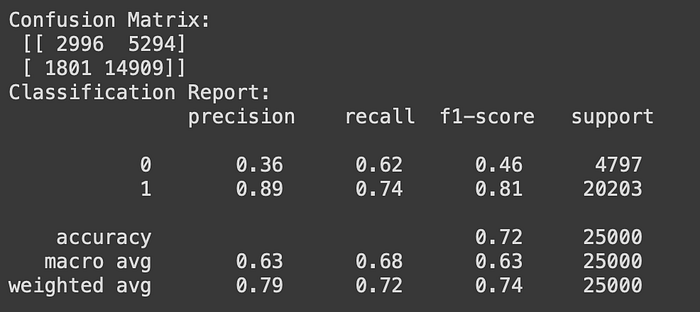
This model gets accuracy at 0.72. Compare the precision score from Logistic Regression Model near similar.
4. Logistic Regression with Exclude Lower Correlation Features
This model uses different features for data train. From the heatmap before, the lower correlation features more than -0.30 are Customer_ID and Year_Last_Transaction. Because of that, this model excludes this feature from the X variable used before.

The confusion matrix shows the model can’t predict label 0 correctly. All of the label 0 is predicted as label 1, because of that the precision value for label 0 is 0. The Accuracy of this model at 0.67.
This model can be concluded, that removing features can have an impact on the prediction performance of the model. Although these features have low correlation, they are still important and needed.
Wrap’s up
This Project is a part of the Data Analyst Project in the DQLab Platform.
Hello there, this is my first story to tell about the project. I hope I can grow much better in the future. Appreciate any feedback from readers. Hopefully, this story can be useful.
For project demo or source code, you can visit my GitHub on https://github.com/galihwangiputri/customer-churn.git
Thanks for coming 👋.
